


Ready to Get Started
At Provance, we go out of our way to bring you great service. That’s in our digital DNA. Your IT success is our success.
“If you don’t know where you’re going, you might not get there.”
—Yogi Berra Professional Baseball catcher, coach, and manager.
Organizations need goals to be successful, but just having goals is not enough. Being able to translate those goals into actions and then optimizing those actions is equally important. One of the areas that can help organizations do this is data and analytics, an area we at Provance are continually expanding within our products to help our customers.
This framework by Simon Sinek—The Golden Circle—inspires us and we have used this framework as the foundation for developing our analytics reporting capabilities in ServiceTeam ITSM.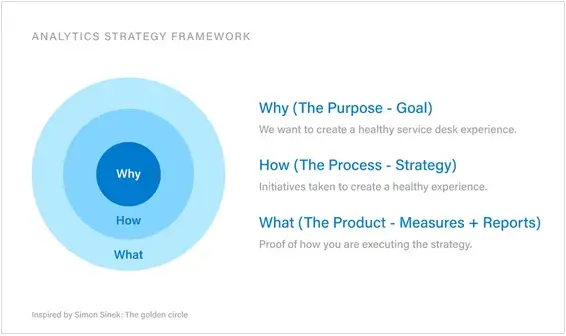
Before we began building the reports and measures, we first looked at why. What were we looking to achieve? Our end goal was to help our ServiceTeam ITSM customers maintain a healthy service desk, and by healthy service desk, we mean a service environment that has a sustainable workload, doesn’t lead to burnout, and maintains open communications. We wanted ServiceTeam ITSM to help managers optimize resources cost-effectively, while keeping their end-users—whether that’s customers or employees—more than satisfied.
Next, we looked at how we were going to help our ServiceTeam ITSM customers achieve a healthy service desk. For example, one of the goals of every service desk is to solve as many tickets as they can and as quickly as they can while keeping their end-users happy. For this, service needs to occur promptly so end-users are not frustrated, and agents can meet their goals without feeling overwhelmed. While many variables impact the service desk and their everyday functions, there are multiple reasons why an agent might not meet their objectives. Situations are invariably changing, and the service desk is expected to adapt to the daily challenges. So, we asked ourselves, “How might we help our customers’ service desk teams to drive actionable results in their ever-changing environment?”
ServiceTeam ITSM relies on Microsoft technology, and so, we decided to leverage Power BI to deliver insight into the day-to-day operations of their service desk. We reviewed all the different service desk activities as well as the data and measures we could surface. We then reviewed the best way to present this information, so that the information is within easy reach and would help managers be more efficient. One of the greatest benefits to the integrated Power BI feature is that managers don’t have to export data from several sources, a third-party application or manage a separate data warehouse. By leveraging Power BI for reporting, our ServiceTeam ITSM customers can utilize near real-time data, managed centrally in the Microsoft Dataverse, making it easy to access, consume and derive value from the data. Our overall goal with these reports is to put much-needed answers to common questions at the fingertips of managers and other stakeholders, reducing their effort and time invested to keep everything running optimally.
This framework helped us bring data to life for our ServiceTeam ITSM customers, providing them with the visibility they need to keep their service desk functioning efficiently.
Create Awareness
Awareness is the first step towards taking action. We create awareness by highlighting the key information impacting various operational areas.
Improved and Informed Decision Making
We help you connect disparate data to draw insights, make informed decisions, and run your service desk efficiently.
Understand Goal Setting
Be in control of the service desk by learning from historical data to set future goals.
Capacity and Capability Planning
We help you to understand where the gaps exist so you can identify the areas of opportunity.
Improve Overall Service Experience
Learning from your end-users and identifying opportunities to improve the overall service experience.
Next, I’ll review some of our out-of-the-box reports available in ServiceTeam ITSM, which have been designed to bring the benefits outlined above to our customers.
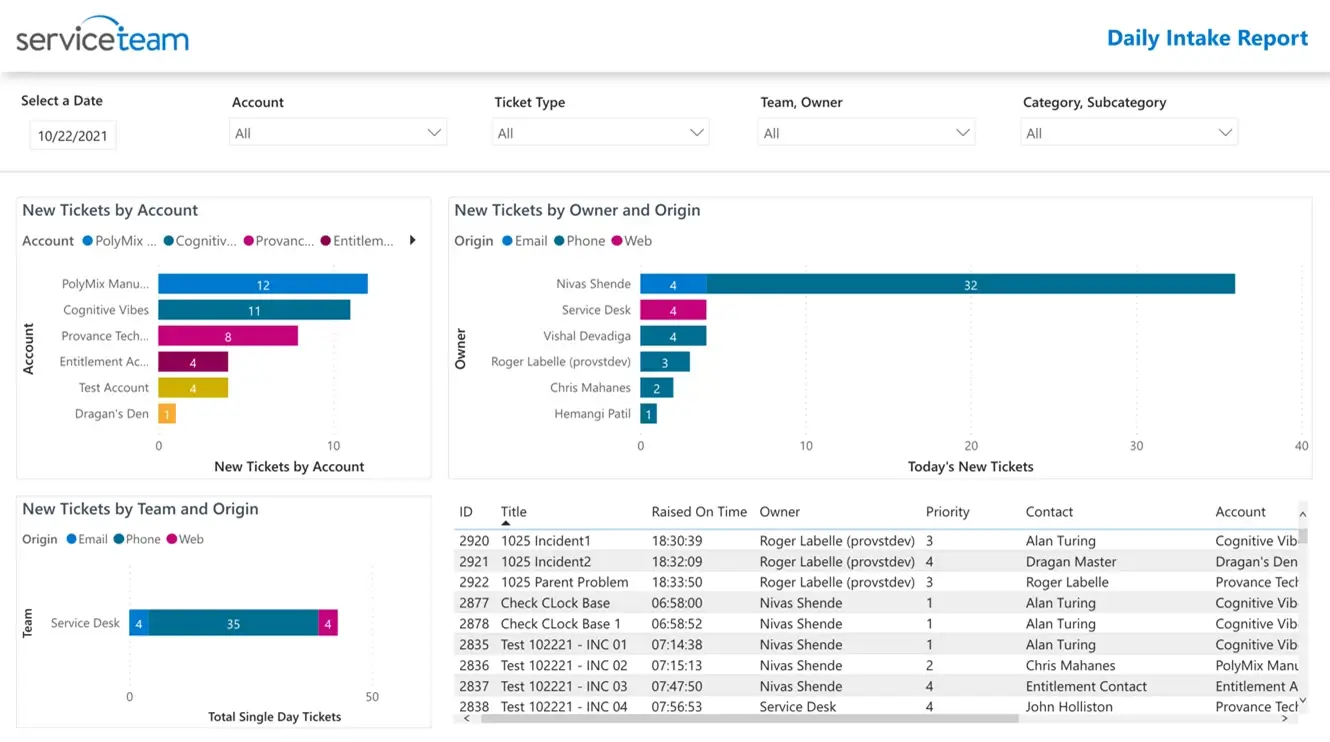
The Daily Intake reports highlight all the new tickets that the service desk has received on a particular day. This allows managers to see the incoming tickets by account, new tickets by owner and origin, and new tickets by team and origin.
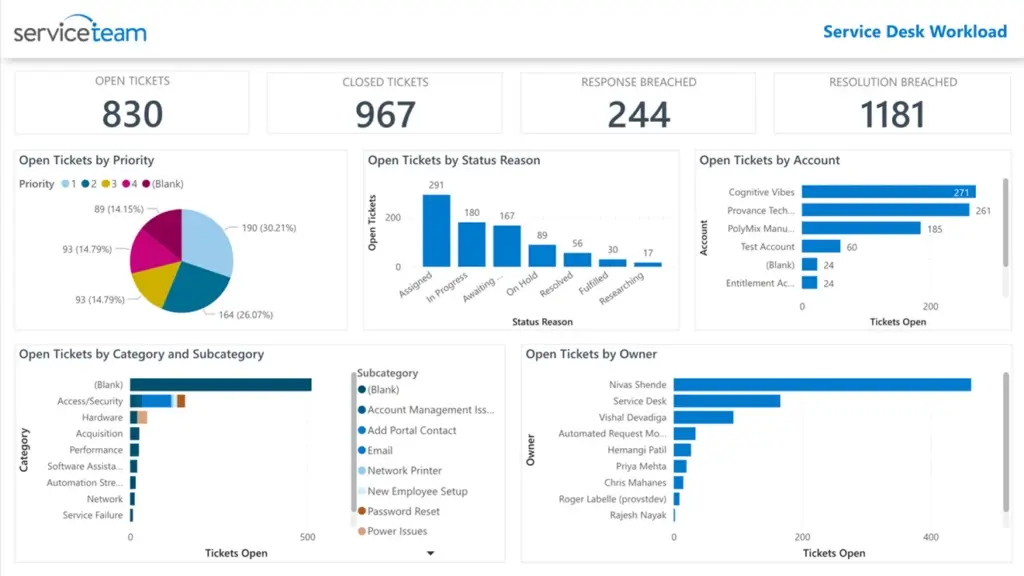
The Service Desk Workload report provides management teams with various ways to look at the overall workload. Managers can monitor all the open tickets by priority, status reason, account, category, and subcategory, and owners (agents). Managers can see the total active tickets, closed tickets, response breached, resolution breached.
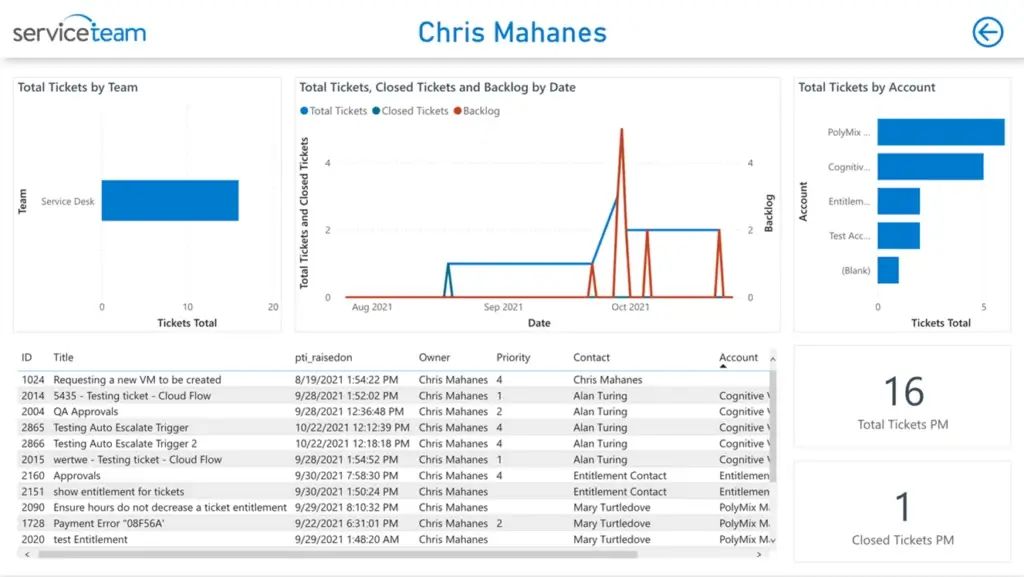
Managers can further drill down to the agent’s workload report to see who the agent is servicing and get more information on individual workloads.
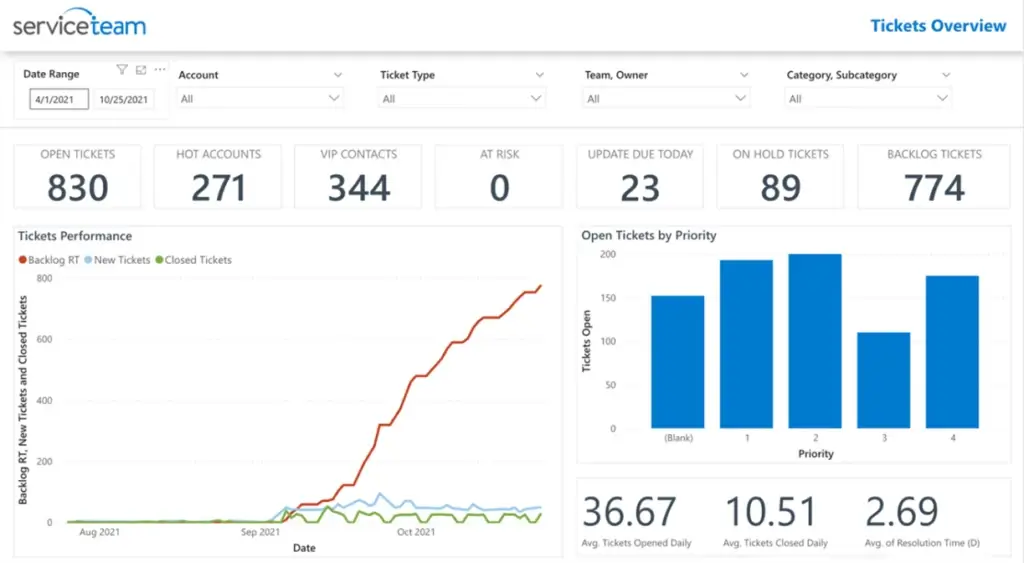
The Tickets Overview report gives managers a snapshot of the current situation and provides actionable information to prevent the tickets from reaching a breached state.
The Tickets Performance chart represents the new tickets that the service desk receives daily, closed tickets, and tickets added to the backlog. This allows managers to see trends over a specific period of time.
Backlog refers to any tickets that are unresolved by the EOD every day. Backlog tickets are a number to watch, so you can anticipate if you need more resources or move some resources to tackle the service desk workload and stay in line with service desk goals.
One of the key objectives of a healthy service desk is to bridge the gap between the closed tickets and the backlog tickets over a period of time. One of the indicators that the service desk is doing well is when the rate and trend of ticket closures reduces and eliminates the backlog. In the screenshot shown above the Backlog tickets (red line) and the Closed tickets (green line) are far apart and that’s not a good sign for a healthy Service Desk.
Filters are also available to slice and dice the information based on ticket type, category/subcategory, account, date, team. Looking at the data collectively, managers can move resources or potentially hire more help to reduce the backlog growth and strategize other ways to improve agent productivity.
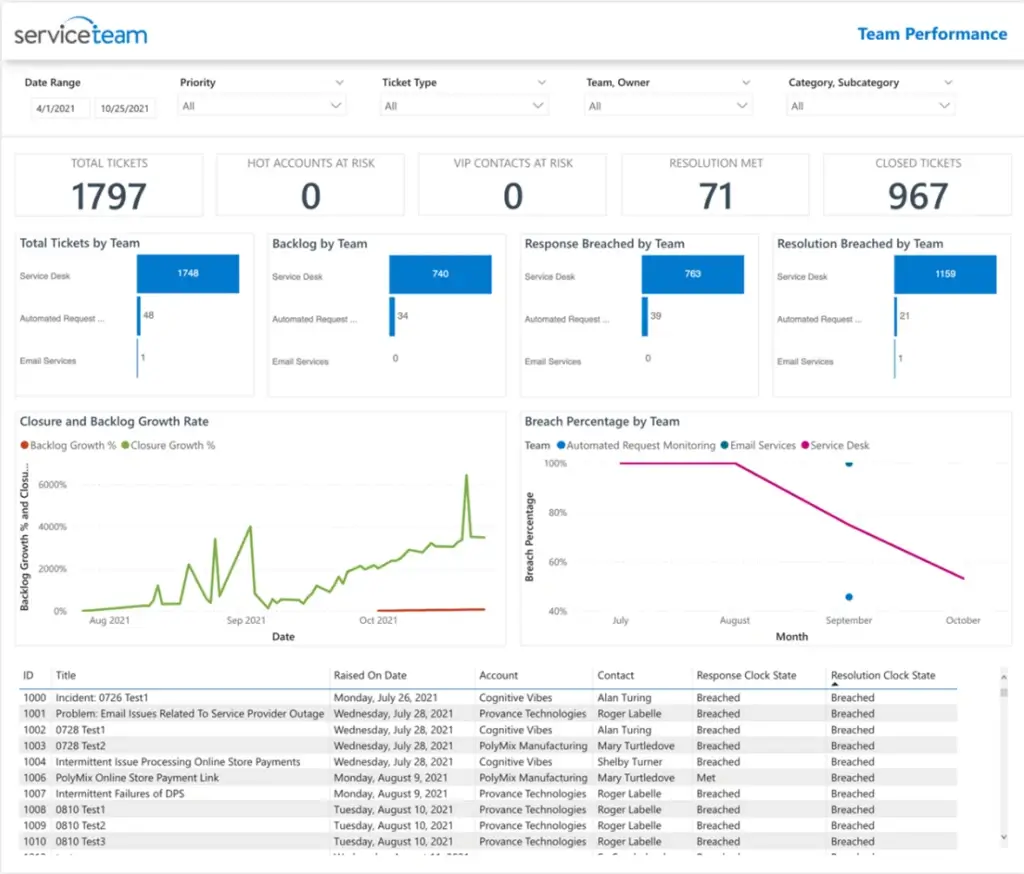
The Team Performance report gives managers the ability to monitor the team’s productivity and how the workload is distributed among the teams. It brings forth the information that would help managers evaluate if there is a balance between the existing workload and the team’s capacity to tackle the workload efficiently. Managers can then make an informed decision on how to service their current and future customers.
The information in the report includes the total tickets by the team, backlog tickets by team, resolution breached by the team, and response breached by the team. We’ve also added metrics such as the closure rate and backlog growth rate so that managers can compare these rates to understand the pace at which the teams are performing.
The breach percentage by the team metric lets managers evaluate how the different teams are performing against their service level objections (SLOs). Having a high breach rate might be a symptom of many things, such as being understaffed, needing to increase training, and more.
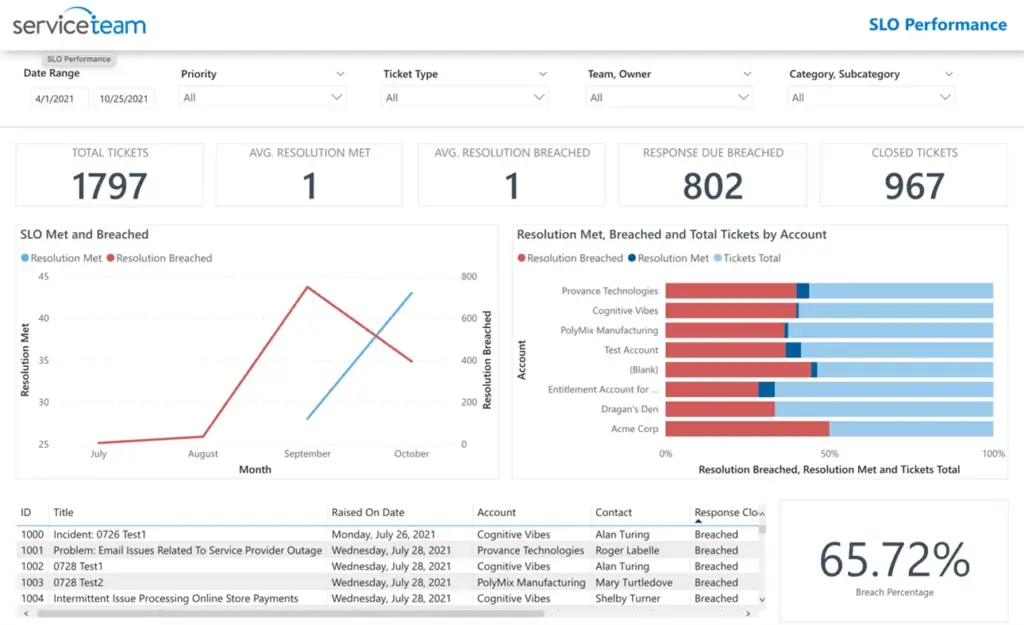
Service Level Objectives (SLOs) report displays information related to service level agreements. The two key measures that make up for the SLOs are response and resolution time and are the key measures designed within service management to provide service efficiently and hold service providers accountable for any discrepancies. Hence, monitoring the SLOs is important.
This report helps managers track the SLOs breached and met.
Managers can also compare the information across accounts. The data cards highlight the total active tickets, the average number of tickets that have met their resolution time, the average number of tickets that breached their resolution time, and their response due time and closed tickets. Naturally, managers want to keep the breach percentage as low as possible.
Additionally, managers can further analyze the reports using the filters on the report.
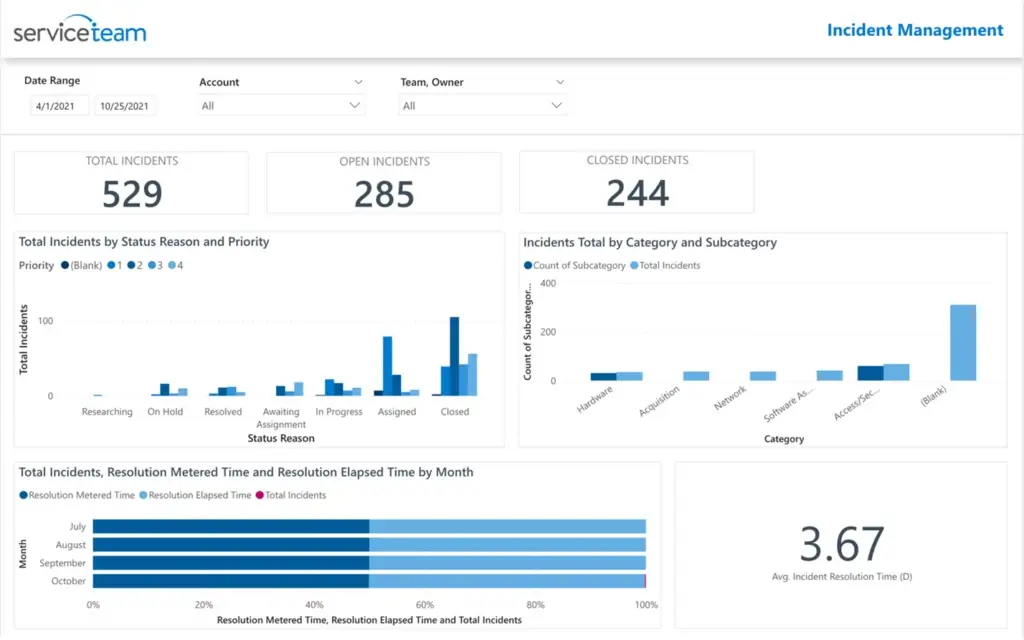
The Incident Management report allows managers to see how many incidents are being handled by the service desk and the rate at which they are being serviced.
Managers can see all incidents based on their priority and status reasons and by the category and subcategory.
The number of incidents recategorized or misdiagnosed helps managers understand if agents need more training in understanding and assessing incidents. Furthermore, it helps clean up the category and subcategory and prevents agents from giving themselves less SLA time to resolve issues. Additional reasons may be when the end-users don’t provide insufficient or incorrect information to the agents.
The avg. incident resolution time metric is useful as a measurement of capacity.
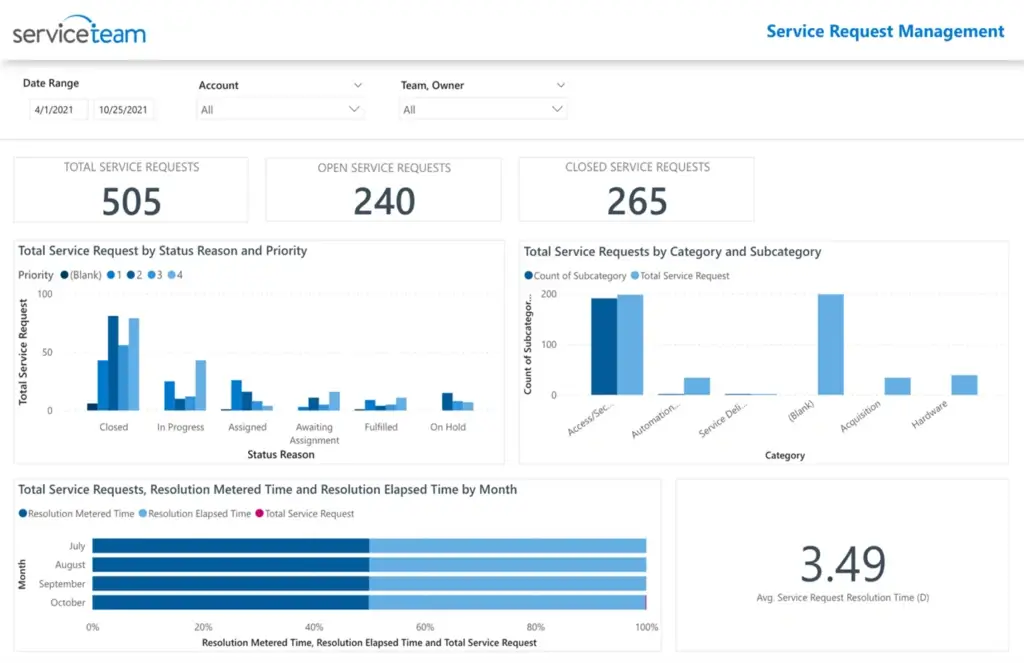
The Service Request Management report allows managers to see how many service requests are being handled by the service desk and the rate at which they are being serviced. Managers can see all service requests based on priority and status reasons and by the category and subcategory.
In the future, this report will compare service request types processed through automation vs. manual, so managers can find opportunities where automation could potentially be introduced.
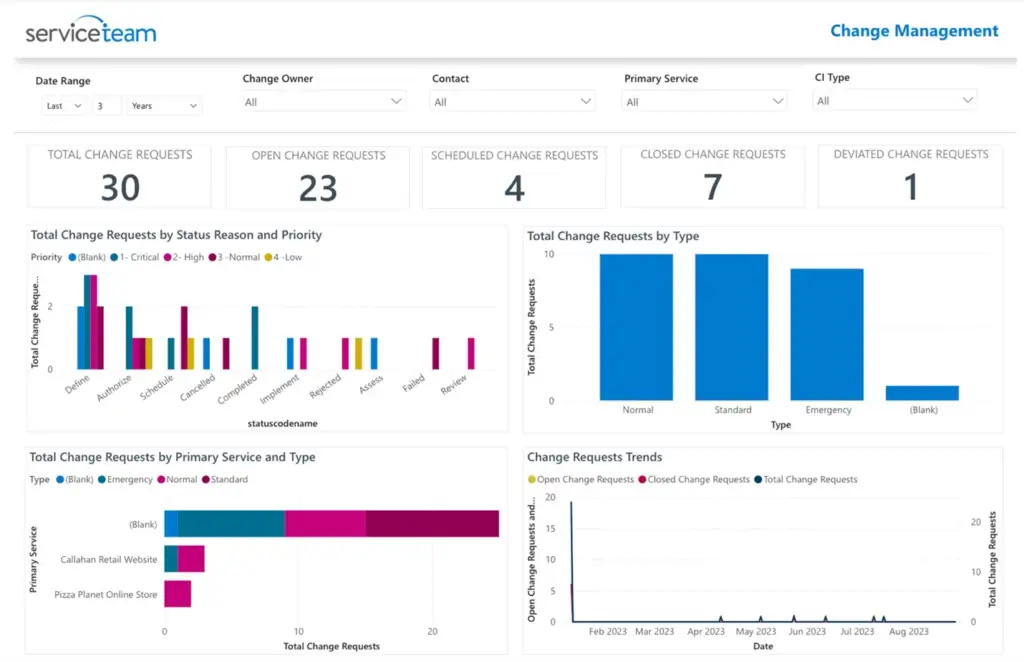
The Change Request Management report allows managers to see total change requests, their status, reason, and priority. It also provides easy-to-identify Total Change Request by Primary Service and Type to identify trends.
Reporting on change requests brings significant value to managers analyzing reasons behind change request patterns that inform process improvements. Managers can identify bottlenecks, address inefficiencies, and anticipate trends in requests to proactively manage demand. Understanding the impact of change requests on service delivery enhances risk management, while service-specific insights highlight areas needing more resources or optimization, and type-based analysis helps prioritize routine versus strategic changes. Regular reporting fosters transparency with stakeholders, while KPI tracking aids performance evaluation. It empowers managers to address issues before they escalate and strategically improve services based on recurring demands and they can use the Provance Service Window Scheduling feature for recurring change requests ahead of time and improve customer experience.
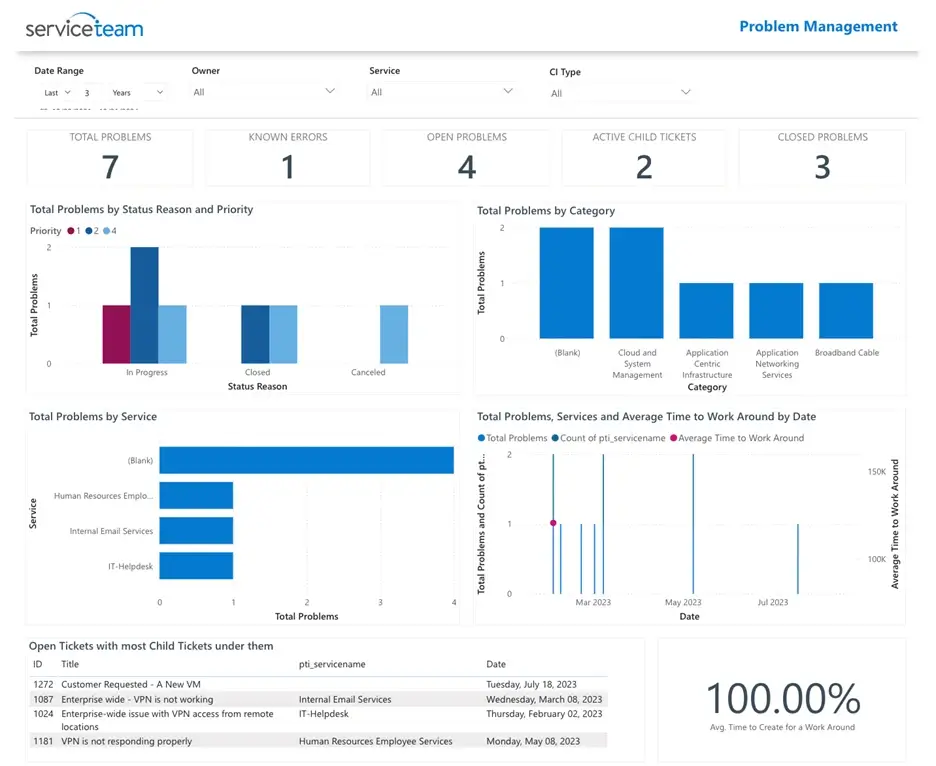
Our Problem Management reporting provides managers with crucial insights that drive operational improvements. Tracking total problems, their status, reason, and priority helps assess the scale and severity of issues, allowing for targeted resource allocation. Understanding the priority ensures that high-impact problems are addressed first, minimizing service disruption.
Monitoring the number of open problem tickets, especially with associated child tickets, helps identify widespread issues affecting multiple areas, enabling managers to focus on resolving root causes and analyzing the reasons behind them.
Categorizing problems helps to group similar issues, allowing for pattern recognition and targeted solutions. This level of visibility ensures that efforts are focused on the most pressing problems.
Metrics such as time to provide workarounds give managers a clear understanding of response efficiency, helping them improve interim solutions to reduce downtime. This can enhance customer satisfaction by ensuring that temporary fixes are provided promptly. Additionally, reporting on problem trends and root causes aids in long-term prevention strategies, helping managers invest in solutions that reduce future incidents and optimize overall service quality.
We know that every service desk operates differently, and conditions are always changing, so we have crafted these reports to meet the general needs of our customers. Of course, it is easy with ServiceTeam ITSM to configure your own personalized Power BI reports, but these out-of-the-box reports provide managers with metrics and variables that will help them understand and optimize their service desk to improve service quality for their end-users.
Here’s some other resources we think you might be interested in:
Blog Post: How ServiceTeam ITSM Leverages User-Centered Methods to Enhance the Agent Experience
Blog Post: Why Our Customers Choose ServiceTeam Over All The Others
Blog Post: Build vs Buy: Here’s 7 Reasons You Should Buy Software Rather Than Build It
Webcast: City of London Transforms IT Services with ServiceTeam ITSM and the Microsoft Power Platform
Blog Post: AI-Driven ITSM – Pioneering Workload Management for the Future

At Provance, we go out of our way to bring you great service. That’s in our digital DNA. Your IT success is our success.